3章 その13 blogクラスタのビジュアライズ
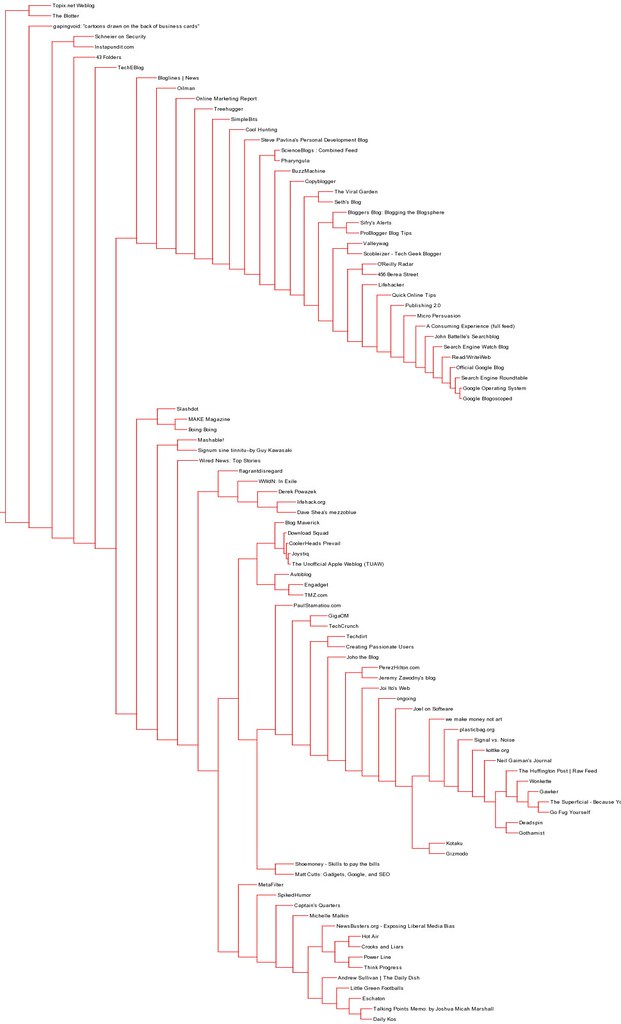
p.42~44より、blogクラスタの図を描く。
Python Imaging Libraryの代わりに、RMagick http://d.hatena.ne.jp/shokai/20081112/1226502119 を使う。使い方も関数名もほぼ同じなので簡単。
あと配列内の一番大きい要素を返すArray.max関数を使った。
http://www.bitbucket.org/shokai/collective-intelligence-study/src/f1912ad66261/03/clusters.rb に関数追加
require 'bicluster.rb'
require 'rubygems'
require 'pp'
require 'RMagick'
include Magick

class Clusters

  # グラフを描く
  def drawdendrogram(clust, labels, imgfile='clusters.png')
    # 高さと幅
    h = getheight(clust) * 20
    w = 1200
    depth = getdepth(clust)

    # 幅は固定されているため、適宜縮尺する
    scaling = Float(w-150)/depth

    # 白を背景とする新しい画像を作る
    img = Image.new(w,h)
    draw = Draw.new
    draw.stroke('red')
    draw.stroke_width(1)
    draw.line(0, h/2, 10, h/2)

    # 最初のノードを描く
    drawnode(draw, clust, 10, (h/2), scaling, labels)

    # 描画、保存
    draw.draw(img)
    img.write(imgfile)

  end

  def drawnode(draw, clust, x, y, scaling, labels)
    if clust.id < 0
      h1 = getheight(clust.left) * 20
      h2 = getheight(clust.right) * 20
      top = y-(h1+h2)/2
      bottom = y+(h1+h2)/2
      # 直線の長さ
      ll = clust.distance*scaling
      # クラスタから子への垂直な直線
      draw.stroke('red')
      draw.line(x, top+h1/2, x, bottom-h2/2)

      # 左側のアイテムへの水平な直線
      draw.line(x, top+h1/2, x+ll, top+h1/2)

      # 右側のアイテムへの水平な直線
      draw.line(x, bottom-h2/2, x+ll, bottom-h2/2)

      # 左右のノードたちを描く関数を呼び出す
      drawnode(draw, clust.left, x+ll, top+h1/2, scaling, labels)
      drawnode(draw, clust.right, x+ll, bottom-h2/2, scaling, labels)
    else
      # 終点であればアイテムのラベルを描く
      draw.font = '/Library/Fonts/Arial.ttf'
      draw.stroke('transparent')
      draw.fill('black')
      draw.pointsize = 10 # 文字サイズ
      draw.text(x+3, y+4, labels[clust.id])
    end
  end

  def getdepth(clust)
    # 終端への距離は0.0
    return 0 if clust.left == nil && clust.right == nil

    # 枝の距離は二つの方向の大きい方にそれ自身の距離を足したもの
    return [getdepth(clust.left),getdepth(clust.right)].max + clust.distance
  end

  def getheight(clust)
    # 終端であれば高さは1にする
    return 1 if clust.left == nil && clust.right == nil

    #そうでなければ高さはそれぞれの枝の高さの合計
    return getheight(clust.left) + getheight(clust.right)
  end
irbで(出力は一部省略)
>> blognames,words,data = cs.readline('myblogdata.txt')
>> clust = cs.hcluster(data)
>> cs.printclust(clust, blognames)
>> cs.drawdendrogram(clust,blognames,'myblogclust.png')
=> myblogclust.png  1200x1940 DirectClass 16-bit 184kb
myblogclust.pngとして保存された。
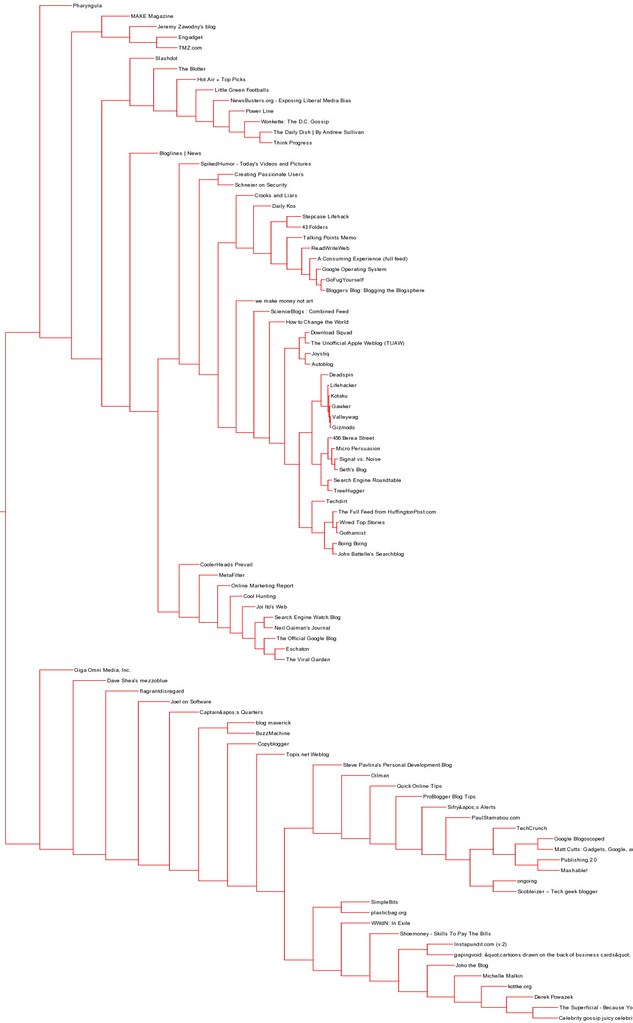
作者サイトで提供されている単語頻出表 http://kiwitobes.com/clusters/blogdata.txt を使うと
>> blognames,words,data = cs.readline('blogdata.txt')
>> clust = cs.hcluster(data)
>> cs.drawdendrogram(clust,blognames,'blogclust.png')
=> blogclust.png  1200x1980 DirectClass 16-bit 183kb
ちょっと本に掲載されている形と違う。どこかアルゴリズム間違えたかも…